I have commented many times in the past few years that the emissions scenarios underlying IPCC climate projections were archaic and focus needed to shift based on historical (observed) emissions away from the emissions set established more than a decade ago.
It is thus refreshing to see in a new short article, written by some of the most well-known names in climate science, the A2 scenario described as “moderate” instead of “extreme” (if it was used in a scientific report in the first place), as was the case even within the last year. The authors accurately state that to achieve the A2 trajectory, which results in some of the warmest global conditions by the end of the 21st century, we would have to drastically reduce our emissions now. I have also written many times that this reduction will not happen any time in the near future. I keep promising some information to back up that claim and I’ll promise it here again. A different recent report further reinforced the need I feel to share with readers of this blog. Hopefully I will have time to write it soon.
I highly recommend reading the article I’ve linked to above. It’s easy to read, short, yet carries a high impact message for those of us experiencing the destructive and sometimes deadly effects of heat waves in recent years (and right now!).
First things first: it’s not a health care bill, it’s a health insurance bill. Tens of millions of people will be made to buy insurance from private corporations. Whether those folks actually receive quality health care is another problem altogether, having mostly to do with socio-economic status. Do you think a child in the poorest part of Alabama will have access to the same level of care as Mitt Romney’s sons or Barack Obama’s daughters?
This is not the result that I predicted beforehand. I did not think the anti-consumer, anti-citizen, anti-Constitution right-wingers on the Court would do anything that might help President Obama. My initial reaction is that Chief Justice Roberts realized the profits the health insurance industry would reap if the law remained in place and that overwhelmed his tendency to stick it to the American people.
Furthermore, I do not think this helps Americans get closer to a universal health care system. in the short to medium term. I think that is the direction most activists are pushing and therefore we will implement such a system sometime in the more distant future. I would like to see individual states offer some version of universal health coverage by themselves and then join cooperatives to expand their population pools.
This gives candidate Romney something to talk about for a while, but there is no way he will actually remove the ACA if he were elected: the industry has already changed too much in preparation for 2014, when the law takes full effect.
Some of the media struggled with reporting this as the following screenshots demonstrate.
Among the reasons: Russia, Canada and Norway will drill, so we should also. This from a “Democratic” administration. This development is the result of increasing corporate control over a government. When people voted for “Hope and Change” in 2008, did they really think that any part of Obama’s administration would stand up to fossil fuel drilling in the most sensitive areas left on Earth? In Colorado, policy allows natural gas drill pads physically closer to elementary schools than are marijuana dispensaries. All this is occurring just two years after one of the worst oil spills in world history – how short is our memory? Maybe people figure as long as the oil only destroys an Arctic ecosystem instead of an ecosystem which Americans might personally experience, then it’s alright.
Shell will receive approval for drilling later this year, according to Interior Secretary Ken Salazar. The article also includes a couple of reassurances that any potential spills in the future will be dealt with quickly because sufficient technologies will be in place already. Once a spill occurs (as they always do), every politician and corporate executive interviewed will lament that nobody could possibly have foreseen an oil spill in the Arctic.
Solar panels and wind farms don’t explode or leak, to say nothing of the lack of carbon emissions from their energy generation. The resources utilized are also common resources (nobody owns the sun or air – yet), so they directly threaten the obscene profits realized by a handful of corporations who now have more rights than American citizens.
The most conservative judges on the Supreme Court since the 1930s issued a decision yesterday that said police could racially profile people in Arizona. Some of the writings and statements made yesterday were overtly political – exactly what judges should not be. The politicization of the Supreme Court by right wing extremists has reached new heights with this group. That was the state of affairs forecasted to occur by non-partisan experts asked to comment on President Bush’s unqualified nominees. And that is the state of affairs that has developed. Based on the aforementioned writings, the conservative judges defended the so-called “right” of Arizona to “defend” itself against people that those in power don’t want in the state: brown people.
Is the immigration system broken? Yes.
Are most government systems broken? Yes.
Why are they broken? Because those same right-wing extremists have put policies and personnel in place to ensure the systems don’t operate as they were designed. The more they can wreck things, the truer their complaints that government doesn’t work rings true. It’s called fulfilling their own prediction.
But hold on one moment. Those same so-called “pro-states’ rights” folks are equally silent on the right of Montana to enforce a 100-year old law to keep corruption out of government. Folks used to publicly pay for legislators – including U.S. Senators – to get the policies they individually wanted implemented. The people of Montana stood up to that kind of nonsense. Alito, Romney, Limbaugh and all the other right-wing nuts out there didn’t say word one about Montana’s right to pass a state law in the absence of national laws and a broken election system.
There are dozens of corporate media articles proclaiming Romney’s unwavering belief that states’ rights are paramount.
Except that it isn’t. The corporate media is part of the problem. If they sold themselves as stenographers, dutifully copying down everything fed to them by whatever source they could dredge up, that would be one thing. But they continue to try to pass their industry off as legitimate. The results? Declining participation in a democratic process. Disapproval of all branches of government. These conditions won’t last forever. Movements will arise and succeed in putting the ship back on course. The wealthy and powerful won’t like it, but that’s not the real issue.
At the end of the day, conservatives believe in states’ rights. Except when they don’t, which is more often than when they do.
May’s global average temperatures were 0.65°C (1.17°F) above normal (1951-1980), according to NASA. The warmest regions on Earth are exactly where climate models have been projecting the most warmth to occur for years: high latitudes (especially within the Arctic Circle in May 2012). The past three months have a +0.56°C temperature anomaly. And the latest 12-month period (Jun 2011 – May 2012) had a +0.52°C temperature anomaly.
According to NOAA, May’s global average temperatures were 0.66°C (1.19°F) above the 20th century mean of 14.8°C (58.6°F). NOAA’s global temperature anomaly map for May (duplicated below) reinforces the message: high latitudes continue to warm at a faster rate than the mid- or low-latitudes. Unfortunately in May 2012, the Northern Hemisphere was almost entirely warmer than normal. The extreme warmth over Siberia is especially worrisome due to the vast methane reserves locked into the tundra and under the seabed near the region. Methane is a stronger greenhouse gas than carbon dioxide,which is the leading cause of the warmth we’re now witnessing. As I discussed in the comments in a recent post, the warming signal from methane likely hasn’t been captured yet since the yearly natural variability and the CO2-caused warming signals are much stronger. It is likely that we will not detect the methane signal for many more years. Of additional concern are the very warm conditions found over Greenland.
Figure 1. Global temperature anomaly map for May 2012 from NOAA.
These observations are also worrisome for the following reason: the globe is still exiting the latest La Niña event:
As the second time series graph (labeled NINO3.4) shows, the last La Niña event hit its highest (most negative) magnitude in December 2011. Since then, SSTs have slowly warmed back toward a 0C anomaly (y-axis). La Niña is a cooling event of the tropical Pacific Ocean that has effects across the globe. It is therefore significant that the past few months’ global temperatures continued to rank in or near the top-5 warmest in the modern era. You can see the effect on global temperatures that this last La Niña had via this NASA time series.
As the globe returns to ENSO-neutral conditions this summer and early fall, how will global temperatures respond? Remember that global temperatures typically trail ENSO conditions by 3-6 months: the recent tropical Pacific warming trend should therefore help boost global temperatures back to their most natural state (i.e., without an ENSO signal on top of it). Looking further into the future, what will next year’s temperatures be as the next El Niño develops?
The record warmth of the past six months in the US was more than just a set of numbers or a temporarily interesting headline. Along with the heat, precipitation for most of the southern half of the country has been below average in the past few months. The result? At least some level of drought conditions exists today across the Western US, with a significant portion of the Southwest (CO, NM, AZ, NV) experiencing Severe drought:
Figure 1. Drought conditions over the West US for the week ending 12 June 2012.
As you can probably tell from Figure 1, the Pacific Northwest had below average temperatures and above average precipitation during the same time period, thus the relative lack of drought in OR, WA, ID & MT.
Interestingly, the areas experiencing the most severe level of drought are also those with the largest wildfires: the High Park fire in my state and the Little Bear and the Whitewater-Baldy Complex (at 289,478-acres as of yesterday!) fires in New Mexico. An additional link to climate change here: the High Park fire is burning in an area that the the pine beetle epidemic has devastated. The epidemic has left over 3.3 million acres of forest in just Colorado with dead trees. The beetles’ population have exploded in the past 20 years as winter nighttime lows warmed enough to allow more larvae to survive the coldest months of the year. This epidemic will transform the inter-mountain West. Combined with the extensive drought, millions more acres of trees will succumb to the epidemic.
Meanwhile, the Southeast finally got some relief in the past week and a half due to very heavy rainfall. The result is clear in the table below: the percent area experiencing drought has dropped significantly, from over 75% three months ago to 57% this week. Unfortunately, the areas with the worst drought conditions didn’t get their long-term drought busted, especially Georgia. This area typically receives some relief from drought during the Atlantic tropical storm season. The Atlantic has been quiet for the past few weeks, however. The Southeast will have to wait a bit longer for additional relief.
Figure 2. Drought conditions over the Southwest US for the week ending 12 June 2012.
Drought has been present across GA for the better part of a year now. The area affected by drought has expanded to neighboring states during the end of the winter and beginning of spring, then shifted in the last month due to weather systems moving through.
There’s no crisis to speak of yet, but inhabitants as well as policymakers should monitor conditions as the year progresses. These conditions are not a result of climate change in any direct way. They are simply a result of a chain of events, some of which (e.g. Arctic ice loss in recent years) are more directly related to climate change than others.
I have argued for some time now with fellow Democrats and liberals about what I perceive as the lack of choice in candidates between the two major US political parties, especially for “higher” offices – President and Senator especially. Yesterday’s news that President Obama restarted an effort begun under the Bush presidency to establish a free trade pact with eight Asian nations, despite clear and unambiguous 2008 campaign promises not to, is the latest evidence supporting my theory.
My theory is the lede: you still get something evil when you vote for the lesser of two evils. This goes out to all the so-called Democratic activists who claim that voting for a “Democrat” is always the only choice. No, it’s not. It’s a terrible long-term plan because right-wingers purposefully grow more extreme, which pulls Democratic candidates and their policies further and further to the right. I only vote for candidates that I think will stop this trajectory. I didn’t think then-Sen. Obama would do that in 2008 and most of his actions since then have convinced me of that opinion.
Compare this:
The newly leaked document is one of the most controversial of the Trans-Pacific Partnership trade pact. It addresses a broad sweep of regulations governing international investment and reveals the Obama administration’s advocacy for policies that environmental activists, financial reform advocates and labor unions have long rejected for eroding key protections currently in domestic laws.
with the 2008 campaign promise:
“We will not negotiate bilateral trade agreements that stop the government from protecting the environment, food safety, or the health of its citizens; give greater rights to foreign investors than to U.S. investors; require the privatization of our vital public services; or prevent developing country governments from adopting humanitarian licensing policies to improve access to life-saving medications,” reads the campaign document.
The administration and its sycophants can spin this free trade effort any way they want – the end result will be the ultimate determination of what President Obama and his backers really want. Read again what I wrote in the first paragraph: Obama restarted the Bush effort. Obama stopped it once he gained office, with a grand public show trying to prove how change-gy and hope-y he was. Then he restarted it without public acclaim. His administration has been negotiating for over 2 years in secret. It’s all bipartisanship-y, which is exactly what the corrupt media inside the D.C. Beltway wants to see, but it’s not what average Americans want to see. Has Obama been campaigning on this effort? No, he hasn’t brought it up once. Nor has he campaigned on the other free trade agreements he’s signed. Our economy falters, which we’re told causes Obama to worry, but the free trade express keeps chugging right along without public debate.
So keep voting for the lesser of two evils. Just don’t expect me to consider a slower march to an evil state a success. A march away from that state would be a success. That’s what I’ll be voting for in November.
The state of global polar sea ice area in early June 2012 has once again fallen below climatologically normal conditions (1979-2009). Arctic sea ice loss is primarily responsible for this change in condition since just last month. Arctic sea ice melted quickly in May because it was thinner than usual; Antarctic sea ice has refrozen at a near normal rate during the late austral autumn. Polar sea ice recovered from an extensive deficit of -2 million sq. km. area three months ago to a +750,000 sq. km. anomaly one to two months ago before falling back to a -1 million sq. km. deficit. After starting the year at a deficit last year, sea ice area spent an unprecedented length of time near the -2 million sq. km. deficit in the modern era in 2011. Generally poor environmental conditions established and maintained this condition, predominantly across the Arctic last year. The last time global sea ice area remained near 19 million sq. km. through May was in 2007, when the Arctic extent hit its modern day record minimum.
Arctic Ice
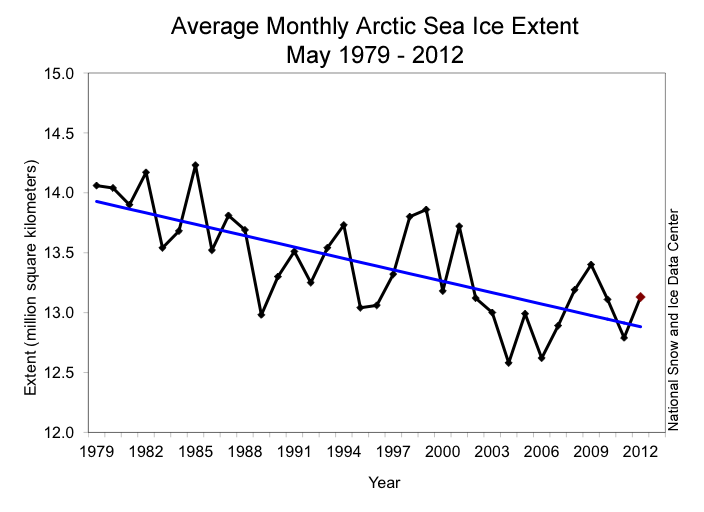
According to the NSIDC, weather conditions during the latter part of the previous winter and spring were less conducive for Arctic sea ice freezing on the Atlantic side of the Arctic while conditions were more conducive than usual for freezing on the Pacific side. Sea ice melt during May was more than normal: 1.62 million sq. km. instead of 1.38 million sq. km. As such, May′s extent was below average for the month in the satellite record. Arctic sea ice extent on in May averaged 13.13 million sq. km. Barents and Kara Sea ice remained very much below normal, more so than in recent years. The Bering Sea, which saw ice extent growth due to anomalous northerly winds in previous months, instead witnessed above normal conditions. Overall, near surface temperatures were warmer than average across the Arctic Ocean.
In terms of longer, climatological trends, Arctic sea ice extent in May has decreased by -2.3% per decade. This rate is lowest in the spring months than the late summer months. Note that this rate also uses 1979-2000 as the climatological normal. There is no reason to expect this rate to change significantly (more or less negative) any time soon. Additional low ice seasons will continue. Some years will see less decline than other years (like this past year) – but the multi-decadal trend is clear: negative. The specific value for any given month during any given year is, of course, influenced by local and temporary weather conditions. But it has become clearer every year that humans are establishing a new normal in the Arctic with respect to sea ice. This new normal will continue to have far-reaching implications on the weather in the mid-latitudes, where most people live.
Arctic Pictures and Graphs
The following graphic is a satellite representation of Arctic ice as of April 28, 2012:
The sea ice in the Bering Sea, as mentioned above, formed more quickly and to a further southern extent than is normally seen, but has largely melted already due to the ice’s young age and thin depth. What remained missing this winter and early spring was the sea ice north of Scandinavia. This is the result of anomalously warm waters from the Gulf Stream being drawn further north than is normal. This is due to the positive AO index & NAO index during the last boreal winter and spring. As a side note, this phenomenon combined with the most recent, moderate La Niña in the Pacific Ocean has led to Dec-May being anomalously warm and dry for most of the U.S. Indeed, this year has been the warmest Jan-May period on record in the US, as I will detail in a separate post.
Overall, the health of the remaining ice pack is not healthy, as the following graph of Arctic ice volume from the end of May demonstrates:
Figure 3 – PIOMAS Arctic sea ice volume time series through May 2012.
As the graph shows, volume hit a record minimum earlier in 2011 before returning to the -2 standard deviation envelope. I understand that most readers don’t have an excellent handle on statistics, but conditions between -1 and -2 standard deviations are rare and conditions outside the -2 standard deviation threshold (see the line below the shaded area on the graph above) are incredibly rare: the chances of 2 of them occurring in 2 subsequent years under normal conditions are very, very remote indeed. Hence my assessment that “normal” conditions in the Arctic are shifting from what they were in the past few centuries. Note further that after conditions returned to near the -1 standard deviation envelope in late 2011/early 2012, volume has once again fallen rapidly outside of the -2 standard deviation area. The chances that this would happen three separate times in three consecutive years is exceptionally remote. That means that natural conditions are not the likely cause; rather, another cause is much more likely to be responsible for this behavior.
Switching back from volume to area, take a look at May’s areal extent time series data:
This winter allowed the extent to do something it had not done for the most recent handful of winters: a return of ice extent to within the -2 standard deviation envelope. Indeed, the extent in April briefly matched average conditions before a relatively warm spell melted ice quickly in mid-April. The reason for this is a shift in wind conditions: speed and direction both changed from late winter through this last month. Those winds piled sea ice up instead of pushing it apart. The disadvantage: ice extent decreased, as seen in Figure 4. The advantage: ice volume grew, as seen in Figure 3. The effect on this September’s minimum extent will indicate how helpful the early season winds were in building sea ice that doesn’t melt every year back up. During May, as I wrote above, melting occurred at a slightly faster rate than normal, resulting in a return to near-record low extent conditions.
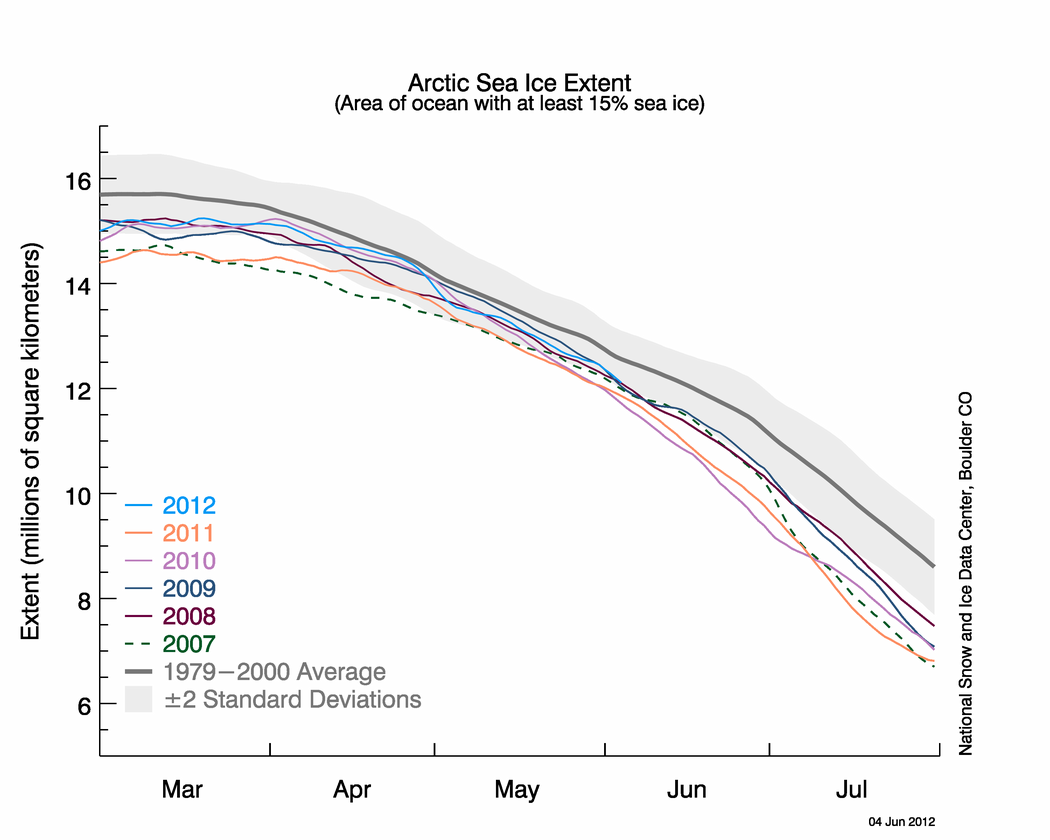
Occasionally, I also like to include a supplemental time series graph that the NSIDC report contains. Here is this month’s supplemental graph:
This graph contains all of the same data as the previous graph and adds the time series lines from the previous 5 winters. As you can see, extent varies during the same month from year to year. The recent decline in extent, caused by a change in wind direction and speed, has reduced Arctic ice extent back to ~13 million sq. km., which is well below normal for May. The past three winters also saw similar magnitude reductions through May, although the starting and ending values were obviously different. Despite these differences in subsequent years, the minimum ice extent values were quite similar: at or near the record low set in 2007. Will fall 2012 be any different or will the surge in ice growth on the Pacific side of the Arctic help to stave off the worst effects seen in the past five years?
Antarctic Pictures and Graphs
Here is a satellite representation of Antarctic sea ice conditions from April 28th:
Ice gain is easily visible around the continent. As a reminder, this is largely and somewhat confusingly due to the ozone depletion that took place over the southern continent in the 20th century. This depletion has caused a colder southern polar stratosphere than it otherwise would be, reinforcing the polar vortex over the Antarctic Circle. That vortex has helped keep cold, stormy weather in place over Antarctica that might not otherwise would have occurred to the same extent and intensity. As the “ozone hole” continues to recover during this century, the effects of global warming will become more clear in this region, especially if ocean warming continues to melt sea-based Antarctic ice from below. For now, we should perhaps consider the lack of global warming signal due to lack of ozone as relatively fortunate.
Finally, here is the Antarctic sea ice extent time series from June 7th:
Antarctic sea ice extent had remained above average to some extent through the austral summer and early spring, which is good news. The difference in conditions from the first part of 2011 to the similar time period in 2012 is obvious: NSIDC measured last year’s extent near the bottom of the standard deviation envelope while this year’s extent is much healthier. Despite the shift in preceding conditions, extent in May 2011 and 2012 returned to normal.
Errata
Here are my State of the Poles posts from May and March.
The Scripps Institution of Oceanography measured an average of 396.78ppm CO2 concentration at their Mauna Loa, Hawai’i’s Observatory during May 2012.
396.78ppm is the highest value for May concentrations in recorded history. Last year’s 394.16ppm was the previous highest value ever recorded. This May’s reading is 2.62ppm higher than last year’s. This increase is very significant. Of course, more significant is the unending trend toward higher concentrations with time, no matter the month or specific year-over-year value.
The yearly maximum monthly value normally occurs during May. Last year was no different: the 394.34 concentration was the highest value reported last year and, prior to the past two months, all time. This May’s value is, as usual, the highest recorded this year – and thus all-time in modern history. If we extrapolate last year’s value out in time, it will only be 2 years until Scripps reports 400ppm average concentration for a singular month (likely May 2014). Note that I wrote in past posts that this wouldn’t occur until 2015.
Judging by the year-over-year increases seen per month in the past 10 years, I predict 2012 will not see an average monthly concentration below 390ppm. Last year, I predicted that 2011′s minimum would be ~388ppm. I overestimated the minimum somewhat since both September’s and October’s measured concentrations were just under 389ppm. So far into 2012, my prediction is holding up.
CO2Now has the following graph on their front page:
It shows concentrations for the month of May in the Scripps dataset going back to 1958. As I wrote above, concentrations are persistently and inexorably moving upward. Alternatively, we could take a much longer view of CO2 concentrations:
Given our historical emissions to date and the likelihood that they will continue to grow at an increasing rate in the next 25 years, we will pass a number of “safe” thresholds – for all intents and purposes permanently as far as concerns our species. It is time to start seriously investigating and discussing what kind of world will exist after CO2 concentrations peak at 850 and 1100ppm. I don’t believe the IPCC or any other knowledgeable body has done this to date. To remain relevant, I think the IPCC will have to do so moving forward.
As the second graph implies, efforts to pin any future concentration goal to a number like 350ppm or even 450ppm will be insanely difficult: 350ppm more so than 450ppm, obviously. Beyond an education tool, I don’t see the utility in using 350ppm – we simply will not achieve it, or anything close to it, given our history and likelihood that economic growth goals will trump any effort to address CO2 concentrations.
I was thinking about what it meant that President Obama didn’t get involved in the Wisconsin Governor recall election today. Obama reinforced the conclusion I came to: Obama cares about Obama in 2012. Period. No other candidate or issue is really on his radar screen: his reelection is all that matters.
All one need look at is this from an email sent by the Obama campaign this afternoon:
Republican Governor Scott Walker and his allies outspent the Democratic challenger nearly EIGHT to ONE — and one of the most unpopular governors in the country managed to hold on.
[…]
Please donate $15 or more to support President Obama and make sure people, not special interests, decide this election.
Obama didn’t stump for Walker’s Democratic challenger in the past month – in much the same way that Obama let 2010 slip by without getting engaged in races that would make a difference to his agenda. As a result, Wisconsin is still led by a deeply unpopular right-winger and the recall election lead-up to the validated the right’s approach to burying opponents in money.
After refusing to stand up to the right in Wisconsin, Obama wants to use the election results to fundraise off of me and millions of other Americans. That might be considered good politics in the insular world of D.C. politics, but it’s bad politics in my book. I’ll continue to donate to and work for local candidates, thank you very much Jim Messina. Obama and other establishment Democrats aren’t truly interested in getting money out of politics. They’re interested in getting reelected so they stay in power.


