Weatherdem's Weblog

Bridging climate science, citizens, and policy


1 Comment

Research: Ocean Heat Content Continued to Rise Through 2010

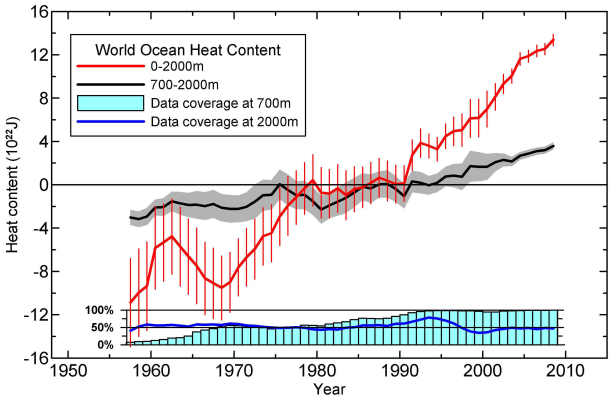
In a follow-up to a previously written paper, Levitus et al. 2012 (subs. req’d) shows that the world’s oceans  continued to absorb heat through 2010:

Two interesting things to point out: most of the heat from 1990 through 2005 stayed in the 0-700m layer (visually subtract the 700-2000m from the 0-2000m time series: the lines diverge), then most of the heat from 2005 through 2010 went into the 700-2000m layer (the lines didn’t diverge nearly as quickly as before).

From the paper’s abstract:

The heat content of the World Ocean for the 0-2000 m layer increased by 24.0±1.9×10²² J (±2S.E.) corresponding to a rate of 0.39 W m-2 (per unit area of the World Ocean) and a volume mean warming of 0.09º C.

From the paper’s discussion:

Using model simulations based on AOGCM simulations, Dommenget [2009] concluded that “continental warming due to anthropogenic forcing (e. g., the warming at the end of the last century or future climate change scenarios) is mostly (80%-90%) indirectly forced by the contemporaneous ocean warming, not directly by local radiative forcing.” Thus even if greenhouse gas emissions were halted today than [sic] regardless of the residence time of the carbon dioxide in today’s atmosphere, the ocean would continue to heat the atmosphere [Wetherald et al., 2001] .

All the major ocean basins (Pacific, Atlantic, Indian) saw increased heat content at almost every latitude, according to the Argo dataset.  The reason the ocean would continue to heat the atmosphere should be obvious from the paper’s figure above as well as this related figure:

The surface warming to date (0.74°C or 1.37°F – IPCC AR4 WGI) is but a small fraction of the surface warming that will result from the heat imbalance currently affecting the planet.  Additional greenhouse gas emissions will lead to further heating and warming.

Roger Pielke Sr. commented on this paper here.  He talks about the difference between the recorded heat content and a statement made by NASA’s Jim Hansen in 2005.


1 Comment

67% Western & 83% Southeastern US in Drought – April 2012

The record warmth of March in the US was more than just a set of numbers or a temporarily interesting headline.  Along with the heat, precipitation for most of the southern half of the country has been below average in the past few months.  The result?  At least some level of drought conditions exists today:

The Pacific Northwest had below average temperatures and above average precipitation during the same time period, thus the relative lack of drought in OR, WA, ID, MT & WY.

Drought has been present across GA for the better part of a year now.  The area affected by drought has expanded to neighboring states during the end of the winter and beginning of spring.

There’s no crisis to speak of yet, but inhabitants as well as policymakers should monitor conditions as the year progresses.  These conditions are not a result of climate change in any direct way.  They are simply a result of a chain of events, some of which (e.g. Arctic ice loss in recent years) are more directly related to climate change.


Leave a comment

March 2012 Hybrid/Electric Vehicle Sales Jump

More of this, please:

Consumers bought a record 52,000 gas-electric hybrids and all-electric cars in March, up from 34,000 during the same month last year.

The two categories combined made up 3.64 percent of total U.S. sales, their highest monthly market share ever, according to Ward’s AutoInfoBank. The previous high was 3.56 percent in July 2009, when the Cash for Clunkers program encouraged people to trade in old gas guzzlers for more fuel-efficient cars.

While obviously not dominating the vehicle market, vehicles that use considerably less gas than most vehicles are selling better than ever.  There will be ups and downs on monthly and yearly basis in the future, of course.  I hope the day isn’t too far off when electrics and hybrids make up 50% of the market.  And to the free-market worshippers: this is how markets should work.  New technologies should receive a little assistance to spur market penetration.

The transportation sector constitutes a significant portion of our greenhouse gas pollution.  Plus it makes good economic sense to spend money on your own car instead of shoveling it over to the most profitable corporations history has ever known.  An important next step is when we deploy charging stations across urban areas.  There isn’t a good reason to pay $15,000 per battery pack.  Then, distributed renewable energy generation will wrap up my vision of the future.  There is, after all, no need to pour dirty fossil fuels into our transportation devices.


Leave a comment

March 2012 CO2 Concentrations: 394.45ppm

The Scripps Institution of Oceanography measured an average of 394.45ppm CO2 concentration at their Mauna Loa, Hawai’i’s Observatory during March 2012.

394.45ppm is the highest value for March concentrations in recorded history. Last year’s 392.40 was the previous highest value ever recorded.  This March’s reading is 2.05ppm higher than last year’s.  As I’ve written before, this increase is significant.  Of course, more significant is the unending trend toward higher concentrations with time, no matter the month or specific year-over-year value.

The yearly maximum monthly value normally occurs during May. Last year was no different: the 394.34 concentration was the highest value reported last year and, prior this month, all time.  If we extrapolate last year’s value out in time, it will only be 3 years until Scripp’s reports 400ppm average concentration for a singular month (likely May 2015).

Judging by the year-over-year increases seen per month in the past 10 years, I predict 2012 will not see a monthly concentration below 390ppm.  Last year, I predicted that 2011′s minimum would be ~388ppm.  I overestimated the minimum somewhat since both September’s and October’s measured concentrations were just under 389ppm.  So far into 2012, my prediction is holding up.

CO2Now has the following graph on their front page:

It shows concentrations in the Scripps dataset going back to 1958.  As I wrote above, concentrations are persistently and inexorably moving upward.

Given our historical emissions to date and the likelihood that they will continue to grow at an increasing rate in the next 25 years, we will pass a number of “safe” thresholds – for all intents and purposes permanently as far as concerns our species.  It is time to start seriously investigating and discussing what kind of world will exist after CO2 concentrations peak at 850 and 1100ppm.  I don’t believe the IPCC or any other relevant body has done this to date.  To remain relevant, I think the IPCC will have to do so moving forward.

Additionally, efforts to pin any future concentration goal to a number like 350ppm or even 450ppm will be insanely difficult: 350ppm more so than 450ppm.  Beyond an education tool, I don’t see the utility in using 350ppm – we simply will not achieve it, or anything close to it, given our history and likelihood that economic growth goals will trump any effort to address CO2 concentrations.


Leave a comment

Research: Europe Will Stay Warm If Bering Strait Remains Open

One of the primary concerns of abrupt climate change is the hypothesized shutdown of the thermohaline circulation. The sinking of cooler, denser water in the polar circles and the rising of warmer, lighter water in other locations drives this circulation.  The concern is that a large influx of fresh water (e.g. from the melting of the Greenland ice sheets) could seriously impair this circulation – which helps keep Europe much warmer climatologically than it would be otherwise.

Recent research posits that the abrupt shutdown of the thermohaline circulation would only be possible if water from the Pacific were prevented from flowing into the Arctic Circle – if the Bering Strait were to close.  This happened during the last glacial period (80 to 11kya) when sea levels were much lower than they are today; the land under the Bering Strait was exposed.

Instead, this research concludes that such an abrupt shutdown is unlikely, even given the likelihood of Greenland’s ice sheet melting by significant amounts in the coming century.  The thermohaline circulation is likely to slow down in response to the large influx of fresh water (which is flowing into the Atlantic from Greenland at an increasing rate), but isn’t expected to shut down.  This is fortunate for Europe, which will have better opportunity to respond to shifting climate change effects, given these results.  Other feedbacks in the climate system could still spawn abrupt shifts, but this feedback could be less threatening than previously thought.

Note that these results are only one product of more capable technology: a fully coupled climate model.  This requires funding and proper governance, two things that our overly politicized culture challenges.

Cross-posted at SquareState.


2 Comments

Record Warmth For US In March 2012 & Jan-Mar 2012

The statistics have been compiled and now the analysis and discussion will really start.  It was so warm across the US in March 2012 that the average US March temperature was 8.6 degrees F warmer than any other March on record (dating back to 1895).  The beat out March 1910, the previous warmest March on record (by a decent margin).  If I were to cherry-pick climate records like many skeptics do, I could easily claim that there is global warming from 1910 to 2012.  Actually, I don’t have to cherry-pick the data.  The fact that the 2000s were warmer than the 1990s which were warmer than the 1980s and so on does that for me.  Also, Jan-Mar 2012 saw an average of 42 degrees F across the US – which is 6 degrees F warmer than normal.

Figure 1. Depiction of divisional ranking of March 2012 temperature anomaly [Courtesy NOAA].

Figure 2. Statewide rankings of average March 2012 temperature.  Note the number of states setting all-time warm temperature records (labeled `118` on map with red state backgrounds) and the additional near-records set in another 16 states.  Note also only 1 state had below normal temperatures for the month.  [Courtesy NOAA]

Figure 3. Statistical deviation from normal conditions for March 20th, 2012 as calculated by the GFS model.  This day occurred at the peak of the heat wave and was illustrative of the kind of conditions that were found for days in a row.

Figure 4. Anomalous temperature readings across the US for the week of March 8-16, 2012.

And while it is accurate to say, “This is exactly the kind of scenario which ‘loaded climate dice’ says should occur as the planet continues to respond to man-made greenhouse gases,” that isn’t exactly true in the sense that we can’t show that these conditions won’t occur in climate projections.  Scientists do acknowledge that this warmth is in response to the GHG levels that existed ~25-30 years ago: the accumulation of gases and absorbed energy since then won’t be felt for another generation.

The Summer in March 2012 raises another interesting question: what would have happened if this heat wave occurred instead in July or August – the hottest months of the year for the US?  Moreover, what would have happened if that hypothetical heat wave occurred instead during an El Nino and most of the US happened to be a little warmer than usual anyway, instead of during a moderate La Nina?  If these different phenomena occur at the same time, what will happen in the US; or Europe; or Asia?  We’re simply not prepared for that kind of event.  Of course, the warmth last month is projected to become “normal” for March in the US by the end of the century.  That sounds good until you think about the simultaneous lack of precipitation across much of the country.

I’ll have more on this information later this week.


Leave a comment

Dr. Gray’s Team Trusts Medium-Term, Not Climate Models

Dr. William Gray is renowned for his work on Atlantic hurricanes.  He is also renowned for forcing his opinion related to climate change into discussions by climate scientists (this at the same time saying climate scientists have no business in tropical meteorology predictions…).  So it was with interest that I read a synopsis of his team’s latest seasonal forecast (the team is now headed by one of his former students, Dr. Klotzbach):

Expect one of the quietest Atlantic hurricane seasons since 1995 this year, say the hurricane forecasting team of Dr. Phil Klotzbach and Dr. Bill Gray of Colorado State University (CSU) in their latest seasonal forecast issued April 4.

The privately funded forecast contains interesting comments [emphasis mine]:

Everyone should realize that it is impossible to precisely predict this season’s hurricane activity in early April.

We issue these forecasts to satisfy the curiosity of the general public…

The reader will note that we are incorporating a dynamical SST forecast from the European Centre for Medium-Range Weather Forecasts (ECMWF). Hindcast data provided by Frederic Vitart indicates that the ECMWF model system 3 has significant forecast skill for SSTs across the various Nino regions for September from a 1 March forecast date. We utilize the ECMWF ensemble mean prediction for September Nino 3 SSTs. The ECMWF has recently upgraded to system 4. Hindcast data from this new model is not available yet, but it is assumed that the model has improved skill to system 3. Hindcast data from 1982-2010 show that the ECMWF forecast from system 3 from a 1 March issue date correlates with observed September Nino 3 SSTs at 0.63.

I have some comments about all of this, especially in light of the requirements Dr. Gray would apply to climate projections based on physics while his forecasts are based on statistical correlations derived by looking back in time.

It is impossible to predict precisely any variable into any type of distant future – months or years.  Yet Dr. Gray would have the public implicitly trust his forecasts, despite their limitations, and not climate predictions – which has something to do with the inaccuracy of climate projections.

They’re issuing forecasts to satisfy the public’s curiosity?  What if the public has a curiosity of the climate?  In Dr. Gray’s world, that doesn’t matter – simply because he says so.  The general public is currently being affected by climate change effects – quite a different scenario from hurricanes, which haven’t made landfall in the U.S. in years.  The future effects of climate change will grow in intensity and complexity – shouldn’t the public have access to climate projections so they can properly assess their risk and made decisions accordingly, much as coastal residents should do with potential hurricanes?

The last paragraph is laughable.  After years of telling people how much his technique benefited from observations (hence the statistical nature of his predictions), Dr. Gray’s team “trusts” the EMCWF – a numerical weather prediction model.  But at the same time, Dr. Gray has told the public (and testified to Congress) that models are inherently untrustworthy with respect to the climate.  Sea surface temperatures aren’t too complex to forecast in 6 months’ time, but the climate is more staggeringly uncomprehendable than any climate scientist will ever acknowledge, according to Dr. Gray.  From a scientists’ point of view, a correlation of 0.63, while positive, is far from inherently reliable.  If that’s the best performing variable, the team is relying more on belief than science.  And assuming that a newly upgraded model suite is as reliable as one you’ve performed hindcast verification on is a huge leap of faith.  I could write pages on the number of things that could and do go wrong when models are upgraded – the bugs are never worked out.

Dr. Gray’s hurricane forecasts should receive the same level and type of scrutiny that he demands of climate projections.  That he doesn’t speaks to how unbiased he really is.


Leave a comment

US States Facing Water Impacts from Climate Change Doing the Least About Climate Change

And if you’ve paid any attention to this topic in the past couple of years, it’s not difficult to guess which states those are.  If your state tends to vote Republican in general elections, your state is among those that have planned the least for climate change.  Unfortunately, those states are also characterized by large human populations, agriculture, or both.

Take Texas, for instance, a state that demonstrates how little actual human affairs matter in a governance regime.  Texas experienced the worst drought in its recorded history last year.  It got so bad, many towns had water shipped in by truck because they previously drained their aquifers.  In the pursuit of runaway capitalism and to stick it to the black President, Texas is among the states which has done the least to plan or prepare for additional climate change impacts in the 21st century.  Perhaps they think if the secede from the US or rough up states that adjoin the Great Lakes, they can take care of their current and future water problems.

So what are the rest of us supposed to do?  As red states continue to scream at reality regarding anthropogenic climate change, they’re running dry.  Once cities start running out of fresh water, how should the rest of the country respond?  With benevolence and assistance?  For what purpose – red states already siphon more resources from blue states – blue states are supposed to be alright with additional resource greed?  Once the agricultural center of the country collapses due to intense decadal droughts, what are other regions supposed to do?  There won’t be viable acreage to replace the land that was mismanaged for decades.  The rest of the country will literally suffer from food scarcity because of the intensity of red staters’ belief system.  There won’t be any mea culpas from red staters as the “liberal elite” bail them out from the manifestations of their rigid ideology.  No, red staters will simply demand that it’s the responsibility of those elitists to fix problems that were forced on everybody.

Put another way – how much of your fresh water will you be forced to give up in 30 years because so-called conservatives were overly skeptical regarding viable climate science?